Bring SRT, RTMP, NDI, and browser cameras together
Use configured SRT or RTMP sources, discovered NDI devices, and one-time browser camera invitations as inputs to the same board.
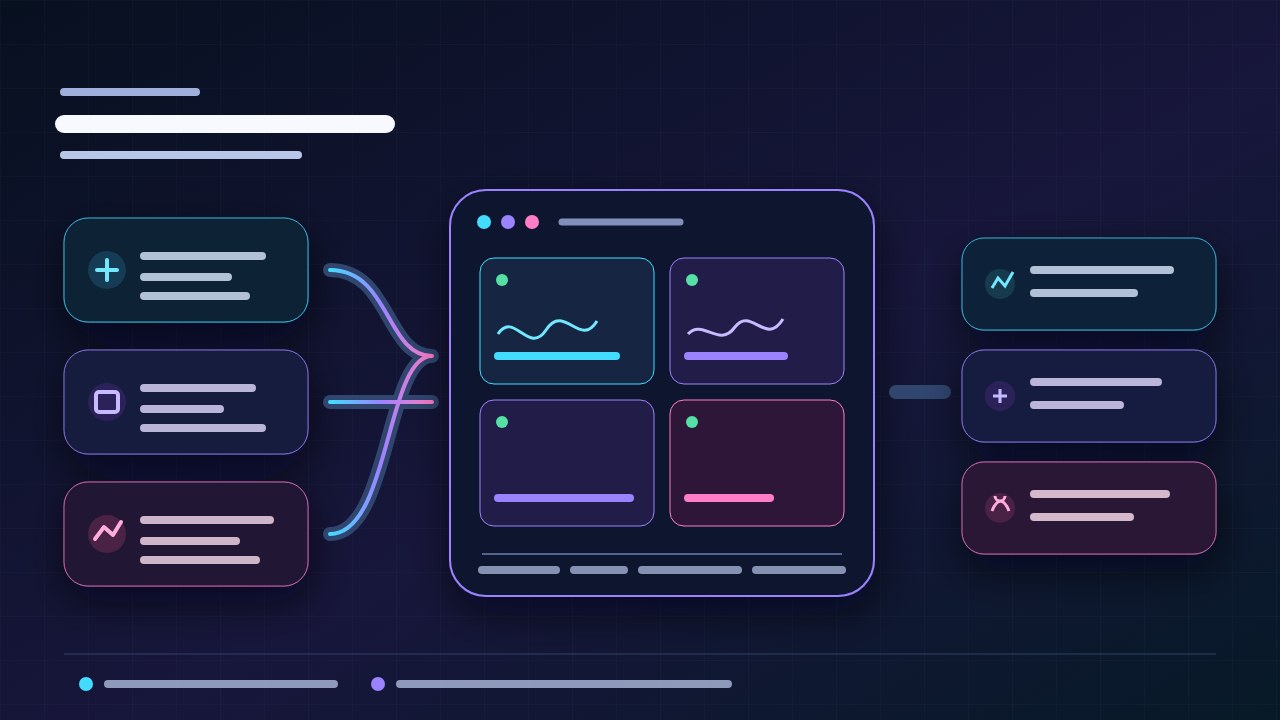
Build a browser-based live video wall from SRT, RTMP, NDI, and invited browser cameras. Choose the layout, inspect each input, and share the board without a separate hardware multiviewer.
Bring configured sources into one private or public board, arrange up to 16 tiles, and keep protocol, codec, bitrate, title, and audio level visible where operators need them.
Callaba turns configured contribution sources into a browser workspace that an operator can start, stop, inspect, and share.
Use configured SRT or RTMP sources, discovered NDI devices, and one-time browser camera invitations as inputs to the same board.
Use single-view, picture-in-picture, 2, 4, 6, 9, 10, 12, or 16-tile layouts and update the board as the production changes.
Expose the title, VU meter, protocol, codec, bitrate, status, mute state, visibility, and volume that belong to each configured input.
Use Multiview anywhere a team needs a shared, browser-accessible view of several live sources.
Give producers and engineers a common view of contribution feeds without shipping a dedicated monitor wall to every location.
Keep contribution, program, and delivery inputs together while operators inspect the state of each tile during a live workflow.
Combine compatible camera feeds in a browser wall for live observation when the requirement is operational viewing rather than a full VMS.
Use the same product workflow with a managed Callaba instance or a self-hosted Callaba Engine deployment.
Launch a Callaba instance and build the board through the web interface without preparing your own server.
Launch in the cloudInstall Callaba Engine on Linux when infrastructure placement, networking, and data control must stay with your team.
Install on LinuxAfter the operator flow is clear, use the Multiview API to create, update, start, stop, inspect, and join boards from your own control plane.
Callaba Multiview is a browser-based live video board that combines configured inputs into an operator-selected layout and exposes the state of each tile.
The reviewed product workflow supports configured SRT and RTMP sources, discovered NDI devices, and browser camera invitations.
The product includes one-tile, picture-in-picture, 2, 4, 6, 9, 10, 12, and 16-tile layouts. The useful layout depends on the number and role of your sources.
A board can be configured as private or public. Treat a public board identifier as shareable access material and use a private board for restricted operations.
Yes. The API exposes reviewed operations for creating, updating, removing, starting, stopping, inspecting, and joining Multiview boards.
Open the demo first, then choose a cloud or Linux deployment when the workflow fits your production.